

How to Build a GTM Dashboard That Doesn't Fail
How the best teams design dashboards that drive retention, efficiency, and real growth for 2026

Dear GTM Strategist!
I don’t believe there is a single universal GTM scorecard everyone should follow.
But I do believe we can come up with clever templates that will help you create your single source of truth based on best practices from companies that are absolutely crushing their GTM game — and some hush-hush tips from investors :)
One of my favourite ways to come up with an ideal solution when I’m working with clients is to “imagine the perfect dashboard” for their business model… and then work backwards to build the reporting system that powers it.
While making that happen almost always requires more legwork from product, ops, and BI teams - sometimes even a data-cleaning project before we start - we should absolutely have a clear idea of what “perfect” looks like for us.
In this newsletter, we are on a mission to:
develop a great GTM scorecard template
check which are the important metrics for 2026
look at the best practices from my network
I asked some MVP GTMs in my network which KPIs are mission-critical to track in 2026 — the ones we absolutely cannot drop the ball on.
Let’s get into it.

This newsletter is kindly supported by Attio - the AI-native CRM built for modern GTM teams. If you’ve ever battled a rigid legacy CRM, Attio fixes that with clean data, real-time visibility, and workflows that actually speed you up.
Today, 5,000+ fast-moving companies rely on Attio’s flexible data model, modern design, and builder-friendly setup to shape their CRM around how they work - not the other way around. It’s built for founders, revenue ops, and GTM teams who need a system that adapts as fast as we do.
So if 2026 is the year you finally break up with your legacy CRM or start fresh on a new project, this is the perfect moment to take Attio for a spin.
What doesn’t get measured can’t get improved. This is why it’s really important to capture the full health of your GTM across different metrics and understand how they are connected.
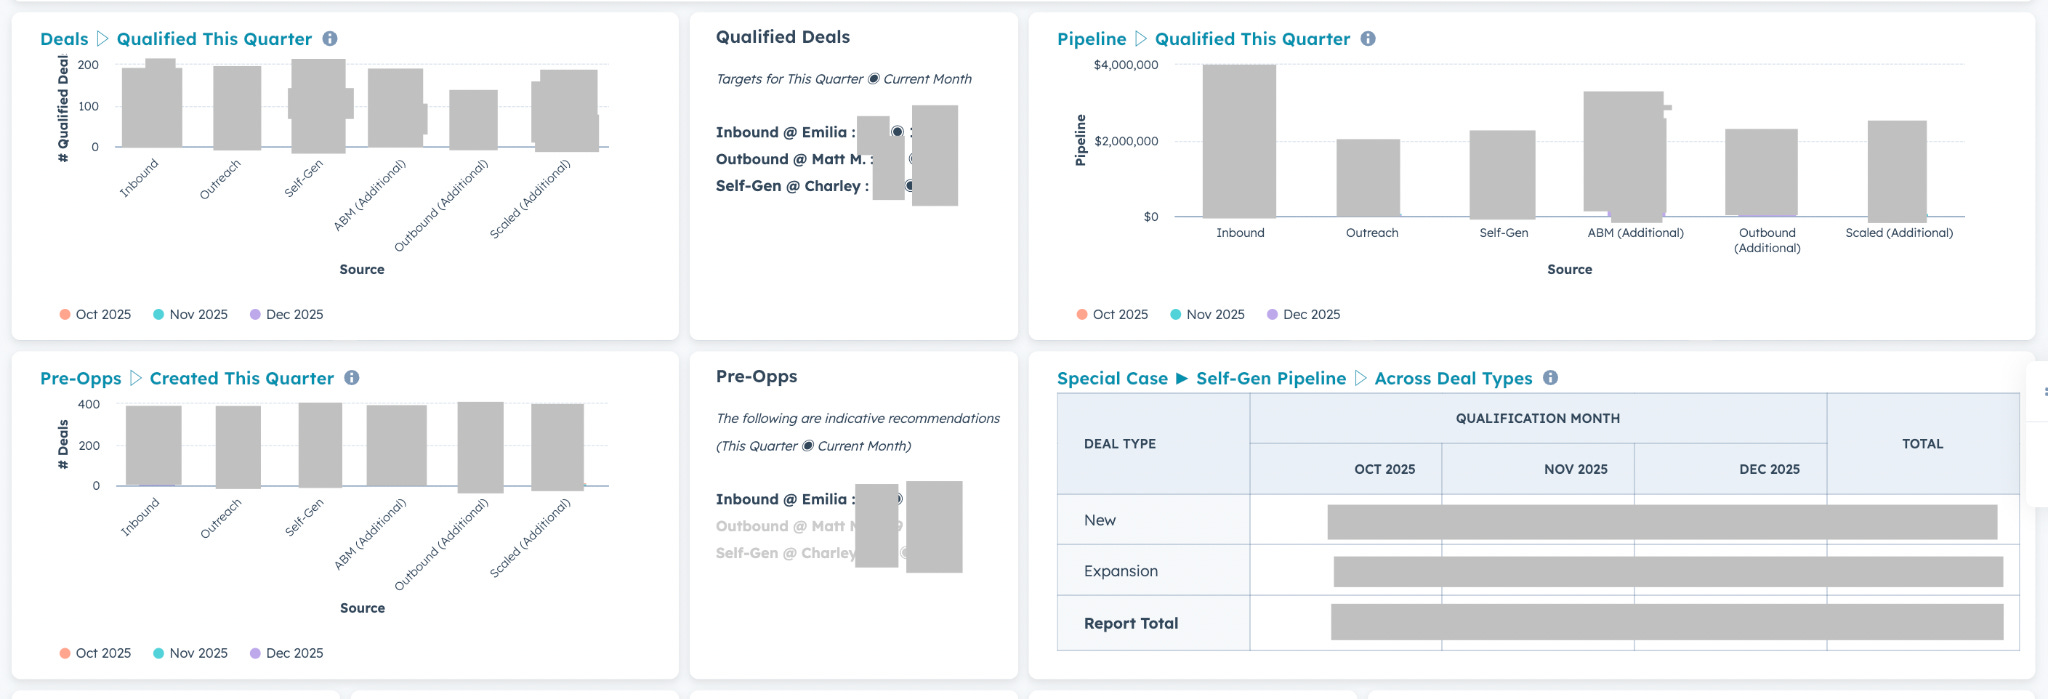
As I am sharpening the toolbox for 2026, I asked my team for inputs on which metrics are important, and we drafted this GTM dashboard together:
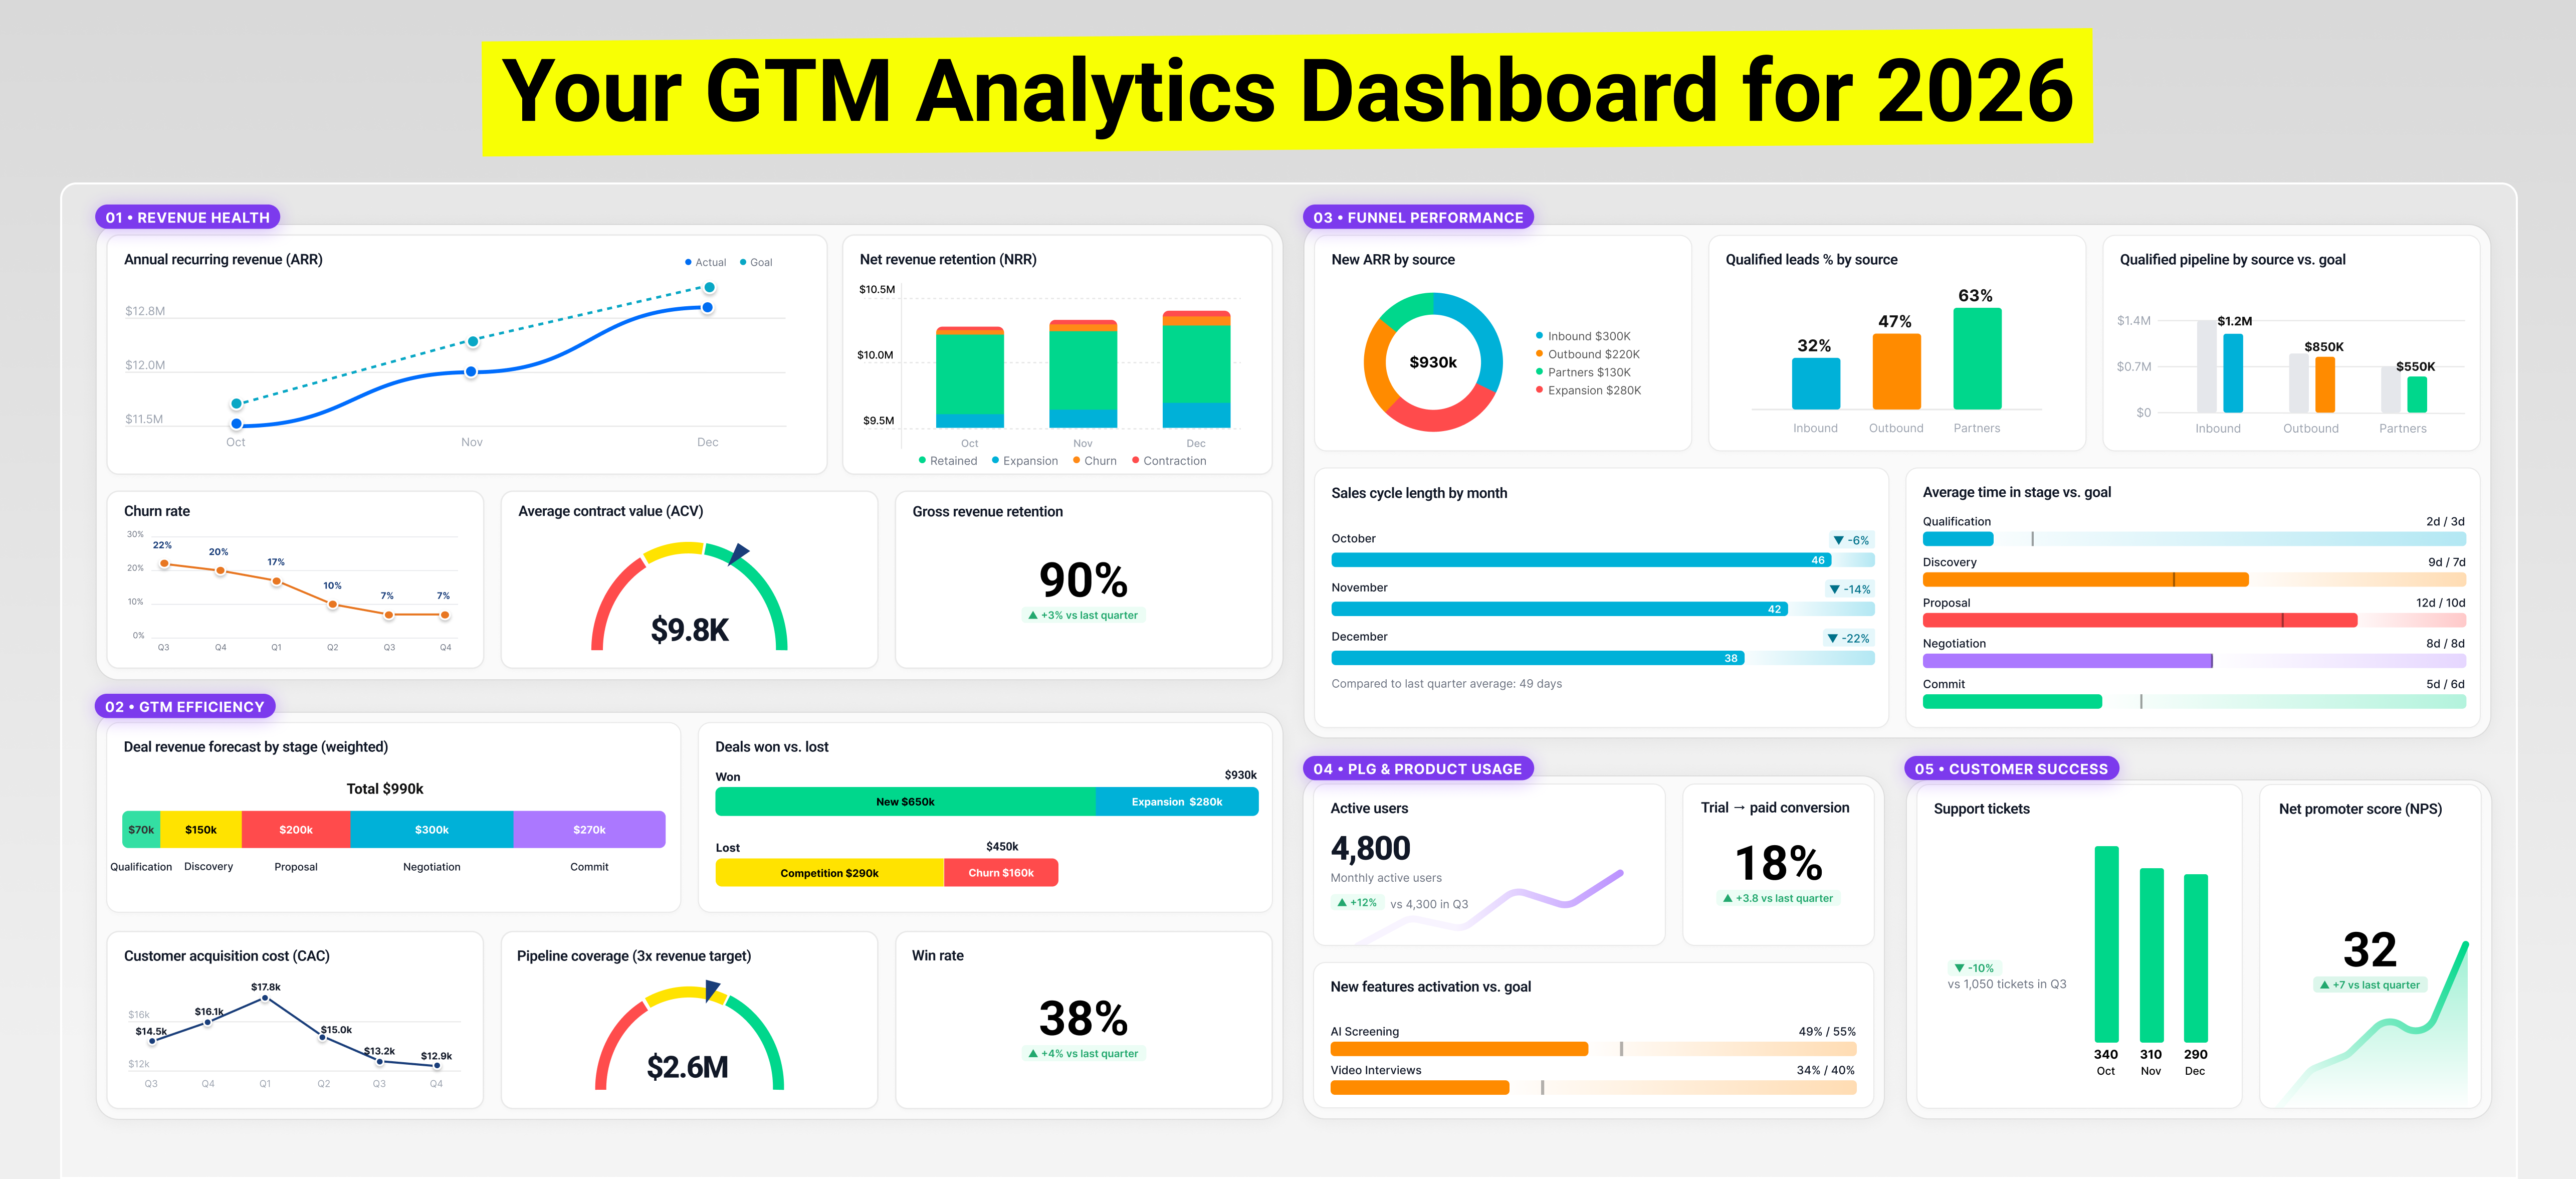
Let’s take a look at the details, starting with revenue health.
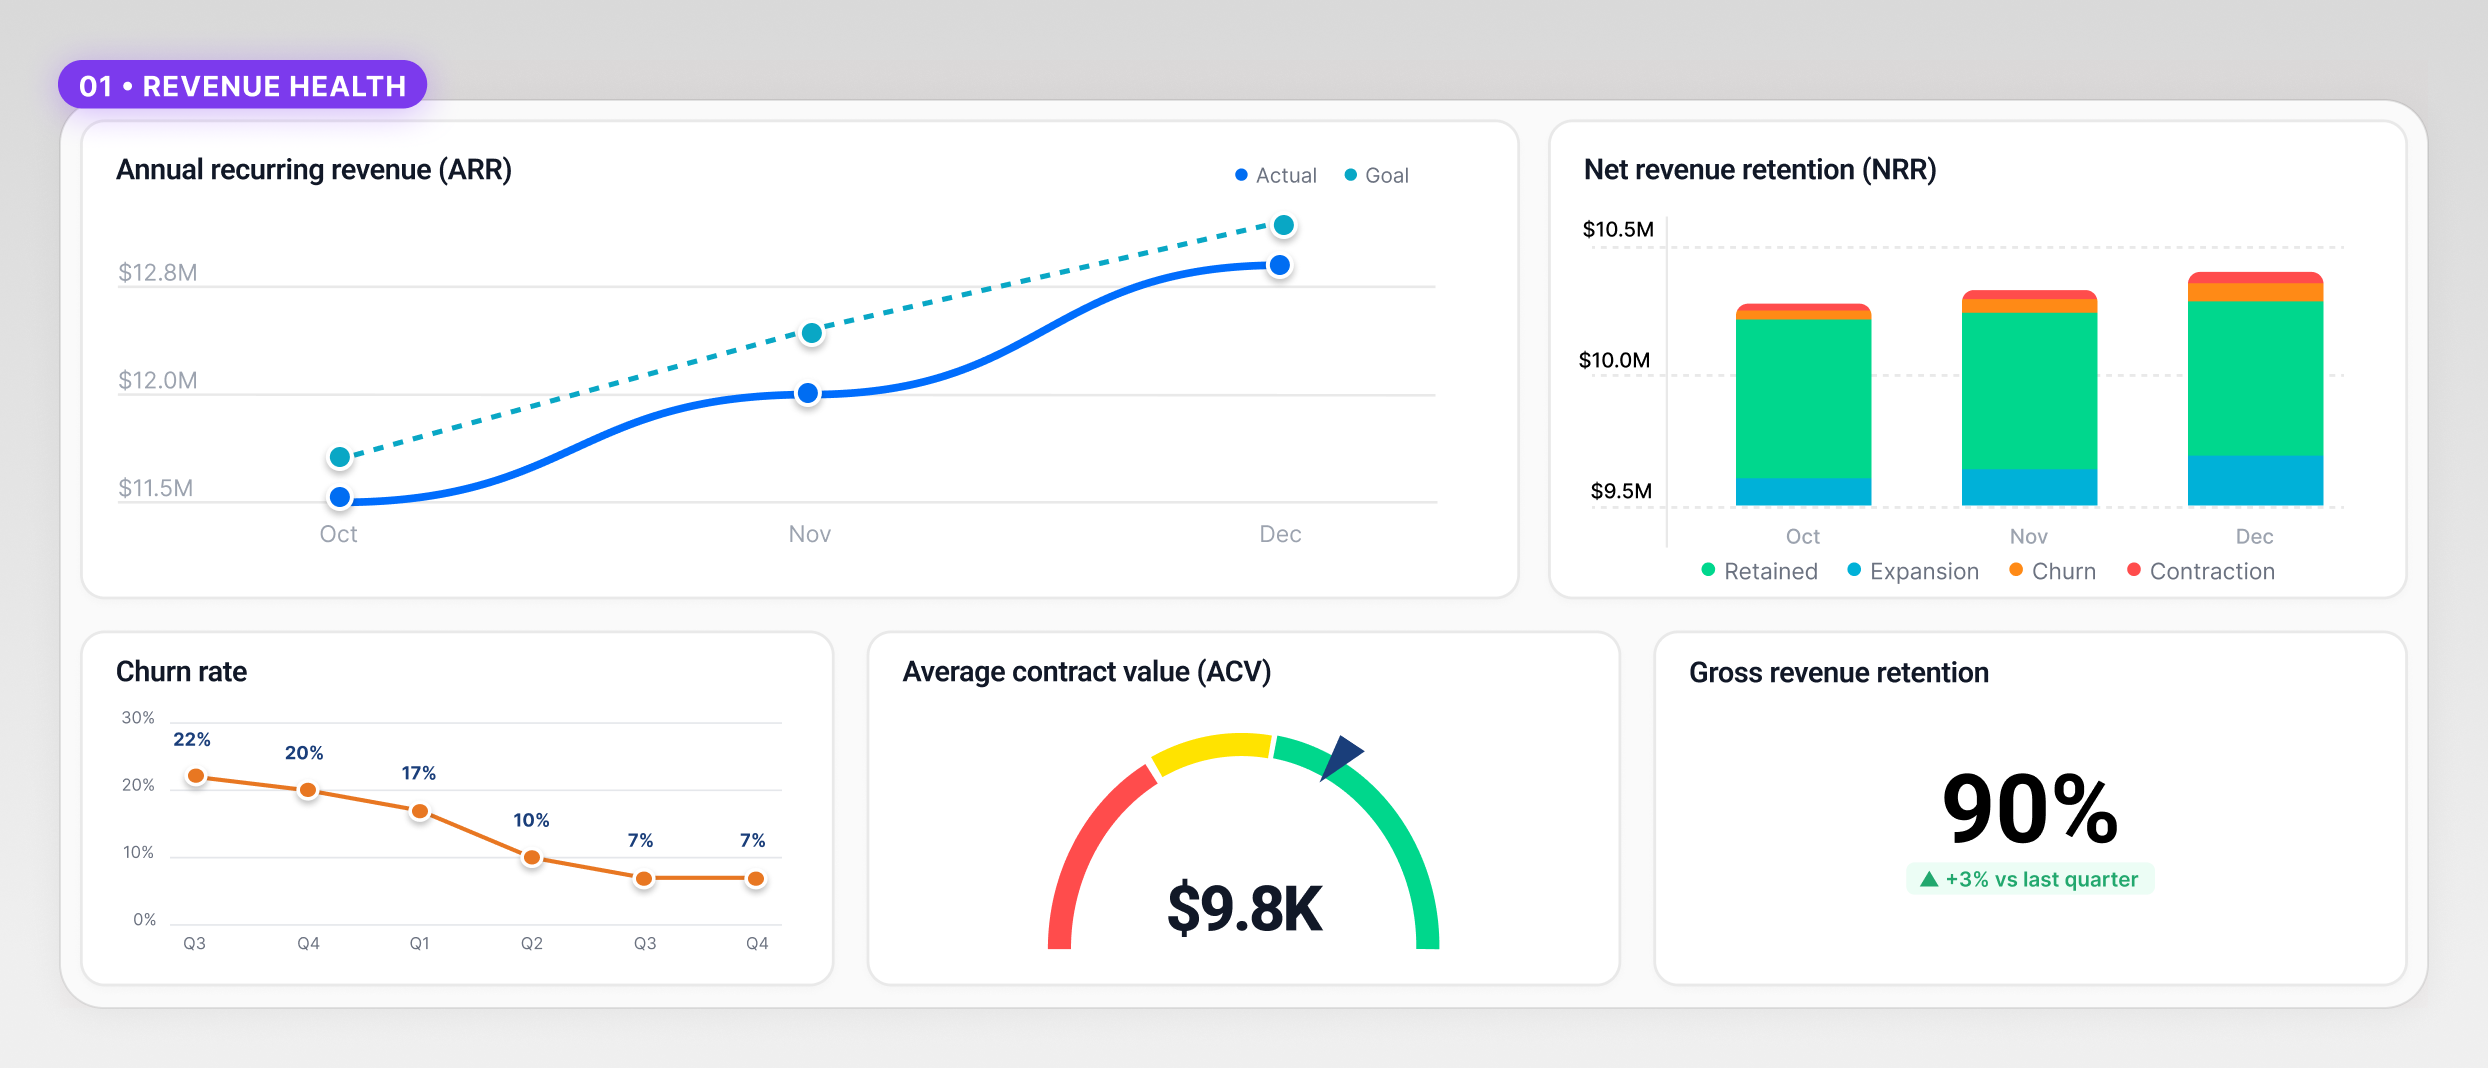
It is important to have a North Star Metric that will define your GTM success. Many companies choose ARR as their north star, but I believe that NRR (Net Revenue Retention) is the most important one to look at.
ARR tells you how big you are getting. NRR tells you how strong you are becoming.
A healthy GTM system starts with retention, not acquisition. If your gross churn is above ~2–3% monthly in SMB or ~8–12% annually in mid-market, you don’t have a growth problem. You have a retention problem. No amount of pipeline or outbound volume will fix that.
This is why GTM leaders obsess over NRR. For SMB, anything below 100–105% means you’re running on a treadmill. For mid-market, 110–120% is the baseline for a scalable motion.
High NRR means you can grow faster with less spend. It reduces reliance on new business, which is the most expensive and least predictable revenue source. Companies with a strong NRR compound while everyone else has to hustle.
This is the foundation layer of the GTM dashboard. Without durable retention, everything that follows is just expensive motion.
Once retention is solid, GTM efficiency becomes the constraint. On the acquisition side, pipeline, win rate, cycle length, and CAC (Customer Acquisition Cost) must be read together, never in isolation.
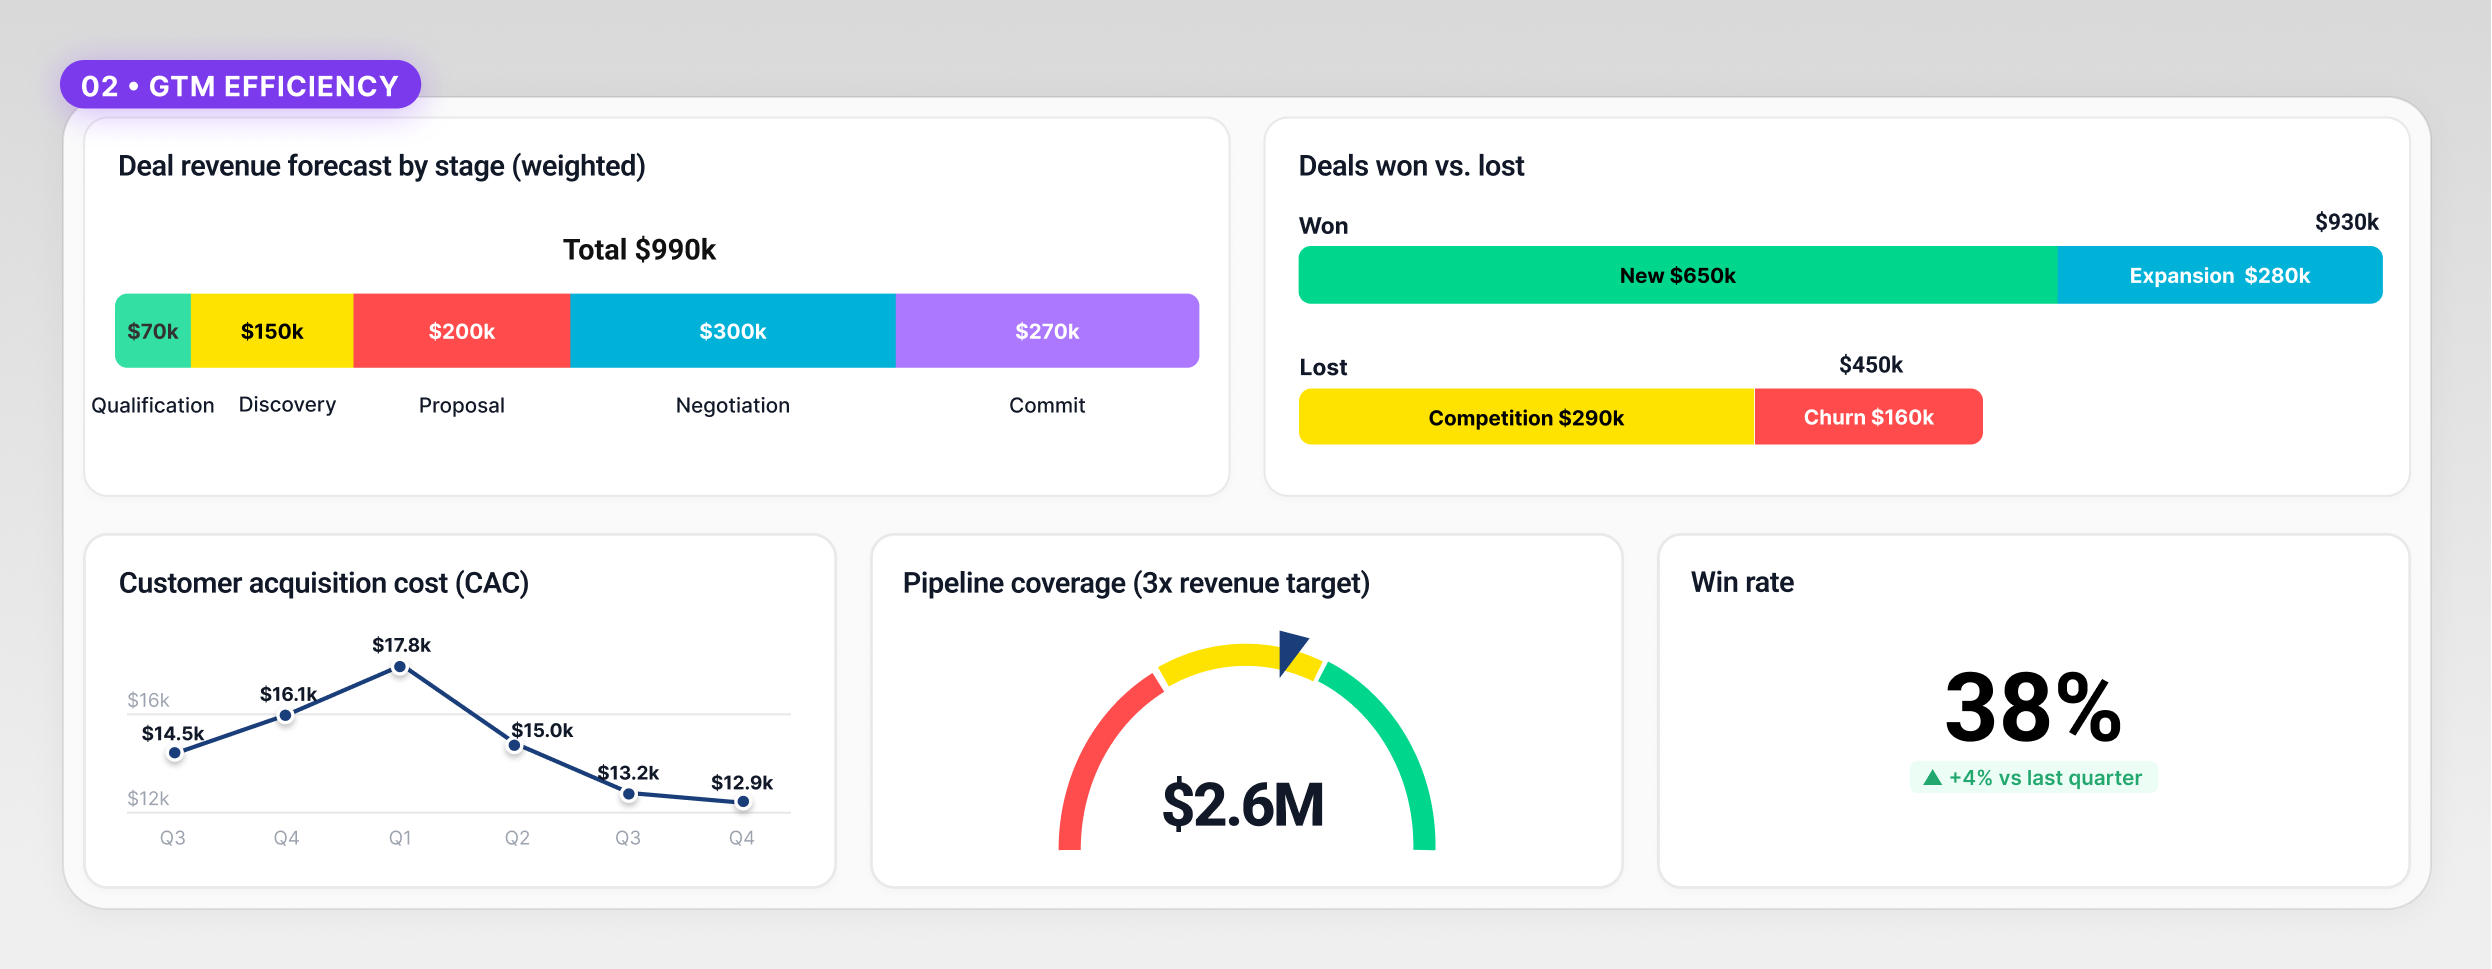
Healthy GTM engines don’t aim for maximum pipeline. They aim for predictable throughput and fast payback. CAC only makes sense when paired with CAC payback and LTV. A higher CAC is acceptable if payback is fast and expansion lifts LTV over time.
A healthy pipeline coverage depends on the market segment you are dealing with. Short-cycle segments typically operate well at 2.5-3.5x pipeline coverage with win rates north of 20-30%. As ACV increases, sales cycles lengthen and win rates drop. Pipeline coverage naturally expands in higher-ACV segments because uncertainty increases (in some industries even 8x).
Funnel performance is where understanding of average time in each deal stage becomes essential. This is where most dashboards fail.
For example, larger deals don’t stall because sales teams are slow. They stall because decision complexity increases. More stakeholders, more risk, more internal alignment required. Tracking time in deal stage helps to show where deals slow down and why.
The most underutilized GTM insight lives between sales and product. That’s why product usage should have its place on the GTM dashboard.
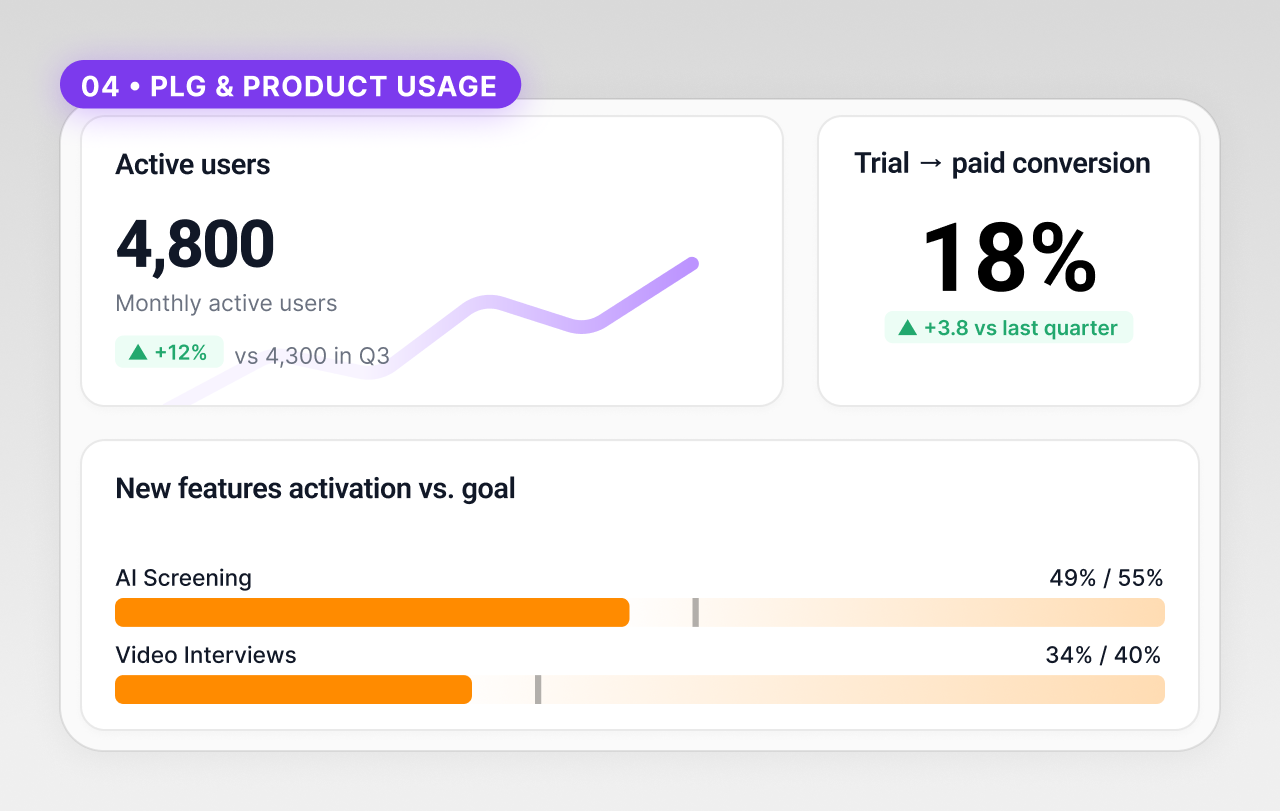
Activation rate, time-to-first-value, trial-to-paid conversion, and feature adoption determine whether retention and expansion are even possible. Healthy SaaS products get users to first value in days, not weeks. If trial-to-paid conversion falls below 20-25% in self-serve or 30-40% in sales-assisted motions, expectations are misaligned. Either marketing is overselling, sales is mis-positioning, or onboarding is broken.
The same logic applies to monetization. Introducing new features as add-ons and tracking activation is almost always healthier than blanket price increases. Add-ons tie revenue growth directly to incremental value. Price increases without value expansion increase churn risk and weaken long-term trust.
Finally, customer success metrics - NPS and support tickets - provide a real-time pulse check on product and support health.
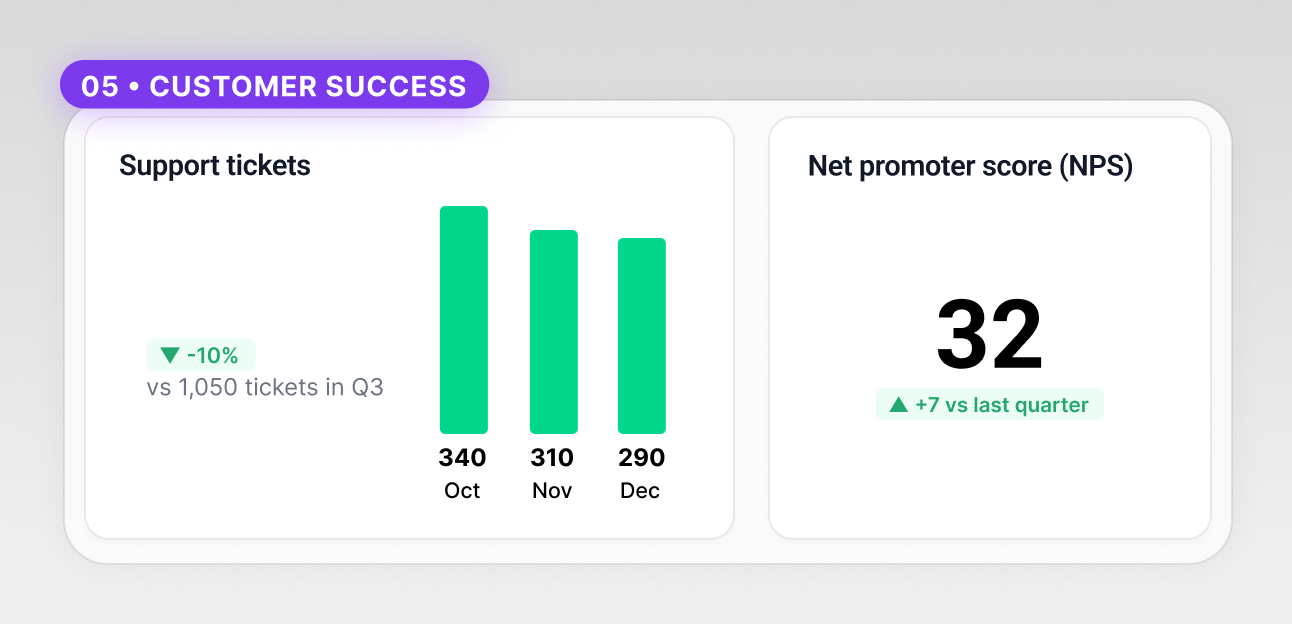
They don’t just reflect service quality. They expose friction in product experience, onboarding, and expectation-setting. Rising ticket volume or stagnant NPS is often an early churn signal, long before revenue reflects it.
A view from the practice and VCs
With dashboards, you don’t need to reinvent the wheel. It’s always good to check what best-in-class companies are doing.
To sanity-check this dashboard, I asked some of my peers to share what their most important metrics are for 2026:
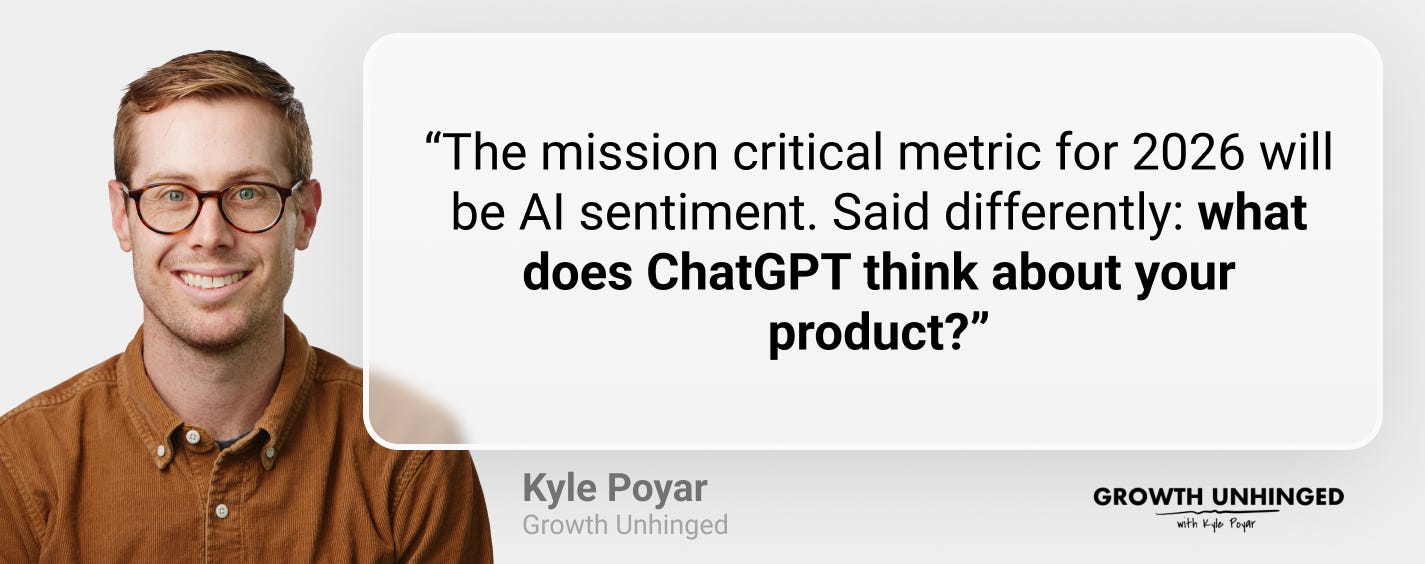
Kyle Poyar, author of Growth Unhinged Substack, added another important metric to the mix: “The mission critical metric for 2026 will be AI sentiment. Said differently: what does ChatGPT think about your product? This will be seen as the “objective” source of truth for buyers who look at the answers to decide which products are right for them and what to look out for. AEO isn’t just about getting mentioned or cited. It’s about being mentioned in a way that makes your product shine.”
Some tools for tracking AEO sentiments that Kyle recommends are AirOps and Profound.
Jonathan Kvarfordt, VP of GTM Strategy & Marketing at Momentum, has 4 mission-critical metrics for 2026:
Sales Velocity
“This shows how quickly revenue moves through the pipeline. I track it across four inputs: number of deals, average deal size, win rate, and sales cycle length. I don’t look at these in isolation anymore. I care about the blended speed across segments and reps. If velocity drops, it’s a signal that something’s slowing down either in messaging, process, buyer readiness, or rep performance. I review this weekly, not quarterly.”
Revenue-Generating Activity Time (RGAT)
“This tracks how much of a rep’s week is spent on activities that lead to pipeline or revenue. Things like discovery calls, deal strategy sessions, pricing discussions, and proposal delivery. I exclude internal meetings, research, note-taking, CRM updates, and Slack threads. The goal is to get RGAT above 60% weekly. Most teams I’ve seen are under 30% without realizing it. This one metric tells me how operationally focused we are on outcomes.”
AI Workflow Coverage
“I track how much of the GTM motion is being supported, automated, or augmented by AI. This includes things like summarizing calls, tagging MEDDPICC fields, surfacing coaching moments, triggering alerts, updating CRM, and surfacing risks. I break it down by team (Sales, CS, RevOps) and function (admin, coaching, enablement, analysis). Right now, if less than 40% of your workflows are covered by AI, you’re behind.”
AI Signals vs. Forecast Accuracy Gap
“I compare what the AI sees - based on buyer behavior, language patterns, urgency markers, champion activity, and objection signals - to what reps are committing in the forecast. The wider the gap, the higher the risk. This isn’t about replacing rep intuition. It’s about spotting blind spots, overconfidence, or missed urgency. I want forecasts that reflect real buying signals, not sandbagging or guessing.”
Jonathan also said that while planning for 2026, you should look at real-time buyer signals (like email response times, meeting participation drop-offs..), AI-augmented rep productivity (deals influenced by AI workflows, time saved/rep/week), lead conversion efficiency (not just lead volume, but velocity and quality per source), and operational slack (how much “dead time” exists in your GTM system while waiting for approvals, onboarding documents, and similar).
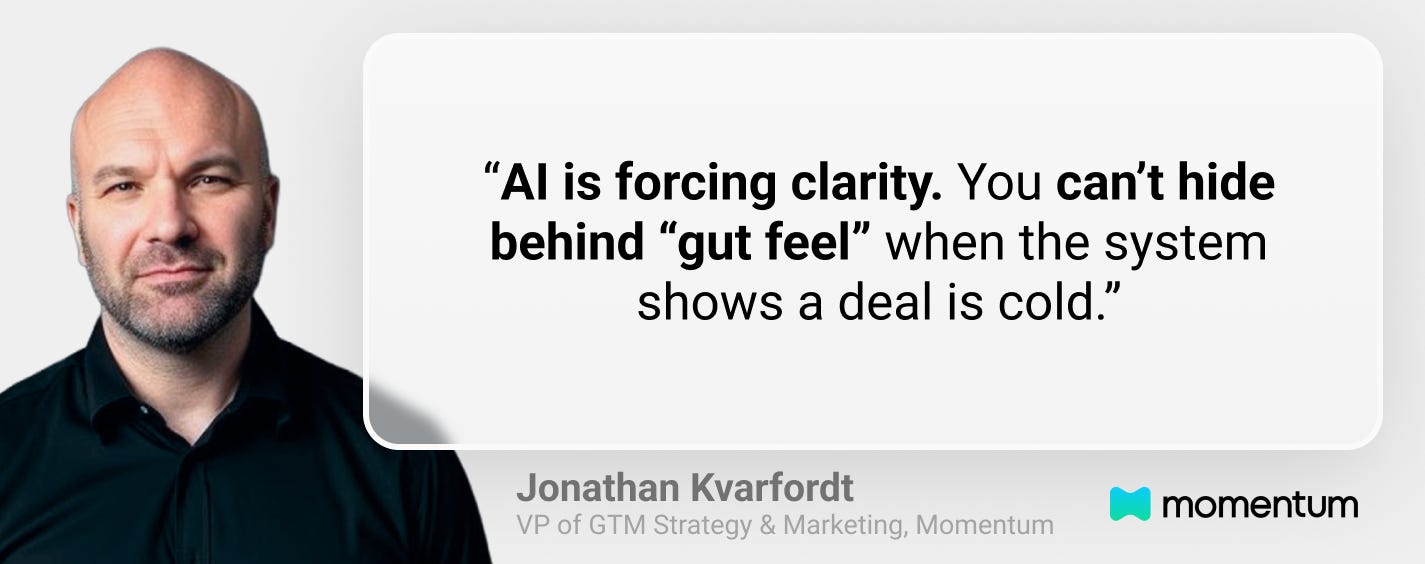
“AI is forcing clarity. You can’t hide behind 'gut feel' when the system shows a deal is cold,” says Jonathan. “Teams are moving from dashboards to live GTM control centers. Everyone is tired of having to open 7 tools to see what’s going on. The shift is toward single-source dashboards that show actions, risks, wins, and blockers by role.”
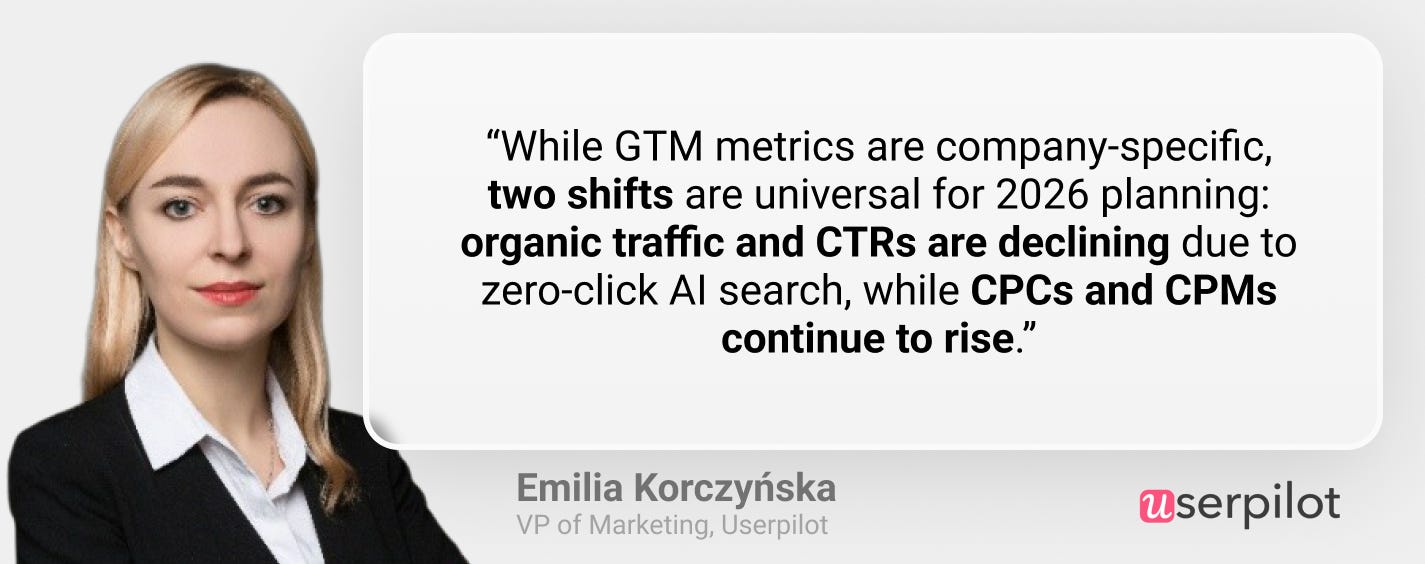
Emilia Korczyńska, VP of Marketing at Userpilot, is focusing on revenue and the leading metrics: “Pipeline, qualified opportunities, pre-ops (demos in our case). We always reverse-engineer the function-specific metrics based on those above (e.g., a realistic pre-opportunity number from organic traffic vs. ABM based on the website/landing page conversion rates and the reasonable increase in organic traffic/ conversion rate and number of clicks on the ads we can achieve with our allocated budget and a reasonable increase in ad CTRs.)”
She specifically observes that organic traffic and CTRs are decreasing (which means that zero click searches are increasing) and that with the advent of LLMs & AI overviews, fewer people are using traditional search engines, especially in tech-savvy niches. This is something to consider when setting organic traffic and conversion targets from inbound. As a result, both CPCs and CPMs are increasing for both cold search ads and display (including LinkedIn ads), says Emilia.
This was the operator's point of view - but it’s also important to know which metrics are relevant for investors and VCs.
So I asked Ivan Landabaso, Partner at JME Ventures and author of Startup Riders newsletter.
“From an investor perspective, the 'mission-critical' 2026 GTM metrics are the ones that answer two questions: is growth real (retention + expansion) vs vibe-revenue (experimental budgets); and is growth efficient (payback + burn),” says Ivan.
Here are his mission-critical metrics for 2026:
• Net Dollar Retention (NDR) + Gross Revenue Retention (GRR) (durability of revenue)
• CAC payback (ideally by segment/channel)
• Burn multiple (net burn / net new ARR) or Efficient Growth Rate equivalent
• Pipeline coverage + pipeline quality (stage conversion + “real” ICP fit)
• Win rate + sales cycle length (speed + predictability)
• Expansion rate (upsell/cross-sell as a growth engine)
• Gross margin including AI/inference costs (profitability is shifting)
• Churn cohorts + time-to-value (leading indicator of retention)
Dashboard is more than just a report
Dashboards only work if they’re used. High-performing teams build habits around them: notifications, simple visual signals, and starting meetings from the dashboard instead of slides. That’s when dashboards stop being reports and start becoming a control system.
A healthy GTM org uses these signals weekly to answer hard questions:
Are we earning the right to scale demand?
Are we closing faster because we’re clearer, or because we’re discounting?
Are customers expanding because they found value, or because Customer Success Managers are compensating for gaps?
If you can’t answer those with data, you’re not running GTM. You’re hoping it works.
Clarity doesn’t come from dashboards alone. It comes from consistently asking the right questions.
The end of the year is a good moment to step back and look at what your system is really telling you.
I wish you Happy Holidays and a strong 2026!
Maja
P.S.: Don’t miss my brand new course - AI-Powered LinkedIn Growth System. It teaches the exact system I use to generate 7M+ impressions a year and 70% of my B2B pipeline. Early buyers are already seeing results - Blas said it helped him clarify positioning and upgrade his LinkedIn strategy halfway through the course. If you want to up your LinkedIn game in 2026, this is the course for you.

The uncomfortable truth most dashboards miss is that you don't need better metrics to predict what's next, you need to diagnose what's already happening in your customer data that contradicts your GTM story. Most teams build dashboards backward: they start with how they want to think about their business, then hunt for KPIs to validate it. The real lever is flipping that. Aggregated deal flow visibility becomes something else entirely when you ask not what the numbers should be telling us about the future, but what pattern in today's buying behavior we've been too busy to notice. That's where the biggest GTM violations hide.
How would you suggest to get payback by segment and channel?
If it’s still last touch attribution reporting, isn’t that a bit dated and misleading of a performance number as more businesses start to adopt media mix modeling and other non-click based measurement techniques?