

You're Probably Scaling at the Wrong Time and Speed
50% of founders scale too late and too slow. Here is how to use your performance data to optimize your scale.


This newsletter is supported by Attio, the AI CRM.
Attio just shipped the biggest update in 2026: completely new Workflows that don’t just automate your work. They do it. Workflows became AI agents.
For years, CRMs reminded you to do the work: update the record, chase the deal, send the follow-up. Attio flipped it. You build an agent once - your best rep’s playbook - and it runs across every account: enrichment, scoring, outbound, briefings, follow-ups. Same standard every time.
And if you can describe the play, Attio builds the workflow for you. Tell it your goal. Review. Run. Close the deal.

Dear GTM Strategist,
When I invite someone as a guest writer, it’s because someone has a way of looking at growth that I think every senior B2B operator on this list needs in their head.
Mark Roberge is that person.
He was the founding CRO at HubSpot, where he scaled revenue from $0 to IPO. He co-founded Stage 2 Capital, which I think of as the most interesting VC firm in B2B - it’s run and backed by 1000+ go-to-market operators from companies like Anthropic, Lovable, Databricks, Zoom, etc. He teaches scaling at Harvard Business School. He wrote The Sales Acceleration Formula and recently published The Science of Scaling. If there is a person on the planet who has watched more B2B companies try to scale, succeed, and crater, it is probably him.
I asked Mark to share something most senior B2B operators are quietly getting wrong right now. The answer landed harder than I expected.
His read: Great businesses are failing unnecessarily due to their scale strategy.. They use gut feel where they should be using operational performance metrics. Half scale too late and too slow. Half scale too early and too fast. The cost of getting it wrong - in either direction - is enormous.
Scale too late and a competitor takes the market.
Scale too early, and you accelerate a broken business into bankruptcy.
What you’ll get in this piece:
Why product-market fit is measurable - and the three-variable definition Mark uses with every Stage 2 portfolio company
What go-to-market fit actually is - and the leading indicators that tell you it’s working before unit economics confirm it
The Stay-Go-Slow framework - the operating cadence Mark uses with boards to scale at the fastest pace the business can absorb without breaking
If you’re planning a 2026 expansion - new product, new market, new motion - read this twice. Then send it to your board.
Over to Mark.
The Second Act Stumble
Steve had a way of making growth sound inevitable.
He had doubled revenue from $27M to $54M in twelve months. The board wanted another lap. Another 2x. Another miracle. They were polite about it, of course, but expectations have a way of sounding like commands when they come from the people who write the checks.
Steve stared at the numbers. The inside sales team was expanding in the U.S. mid-market and could squeeze another $30M out of the current motion. But not $54M. There was a $24M hole staring back at him from the spreadsheet, and Steve hated holes.
The fix, in his mind, was obvious. Build a new product. Sell it to the existing customer base. Dangle it in front of prospects. Slap “platform” next to the company name and watch the deals pile up. He unveiled the plan. Heads nodded. The board was sold.
Engineers abandoned the roadmap. Marketing tore apart the website and rebuilt it around the launch. Sales enablement ran boot camps so every rep could pitch the new product in their sleep.
The customer conference was the coronation. Except it wasn’t.
A year later, the new product had sold 10% of the forecast. Bugs, friction, broken promises. The slick collateral fell flat on impact. Meanwhile, the original engine - the one that had powered the prior year - had been neglected. An entire quarter was burned chasing pipeline for a product that couldn’t carry the weight. By the time anyone admitted it, the company was too far behind to catch up.
Steve didn’t just miss his number. He missed the point.
In the early years, founders understand they shouldn’t commit to a revenue goal too soon. They use design partners. They iterate. They tolerate uncertainty.
Then the company hits scale, launches a new product or enters a new market, and somehow forgets all of it. We assume the playbook from act one will transfer to act two.
It rarely does.
Some institutional knowledge persists. Far less than we assume. When we expand, we have to restart the product-market fit and go-to-market fit process from scratch. The journey should be faster the second time. It is never instantaneous.
So what does that process actually look like?
Product-Market Fit Is Not a Feeling
Every year, I ask the same question - to MBA students at Harvard, to founders in Stage 2 portfolio reviews, to keynote audiences. What is product-market fit?
The answers are always all over the place. A revenue milestone. A customer count. Inbound flow. A “feeling.” I disagree with every one of those.
Product-market fit happens when customers continuously realize the value they were promised when they bought the product. The cleanest quantitative proxy for that is long-term customer retention. When a customer renews, they have effectively re-bought. They are voting with their dollars that the value showed up. Across most categories, the bar is annual retention above 90%.
There’s one problem with that definition. Customer retention is a lagging indicator. By the time you know the cohort retained, you are six to twelve months past the moment you needed the signal.
So the best operators define a leading indicator of retention, or LIR. Some people call it the “aha moment,” a phrase Chamath Palihapitiya popularized at Facebook. The point is the same: identify the specific, instrumentable behavior that predicts long-term retention, and chase it relentlessly.
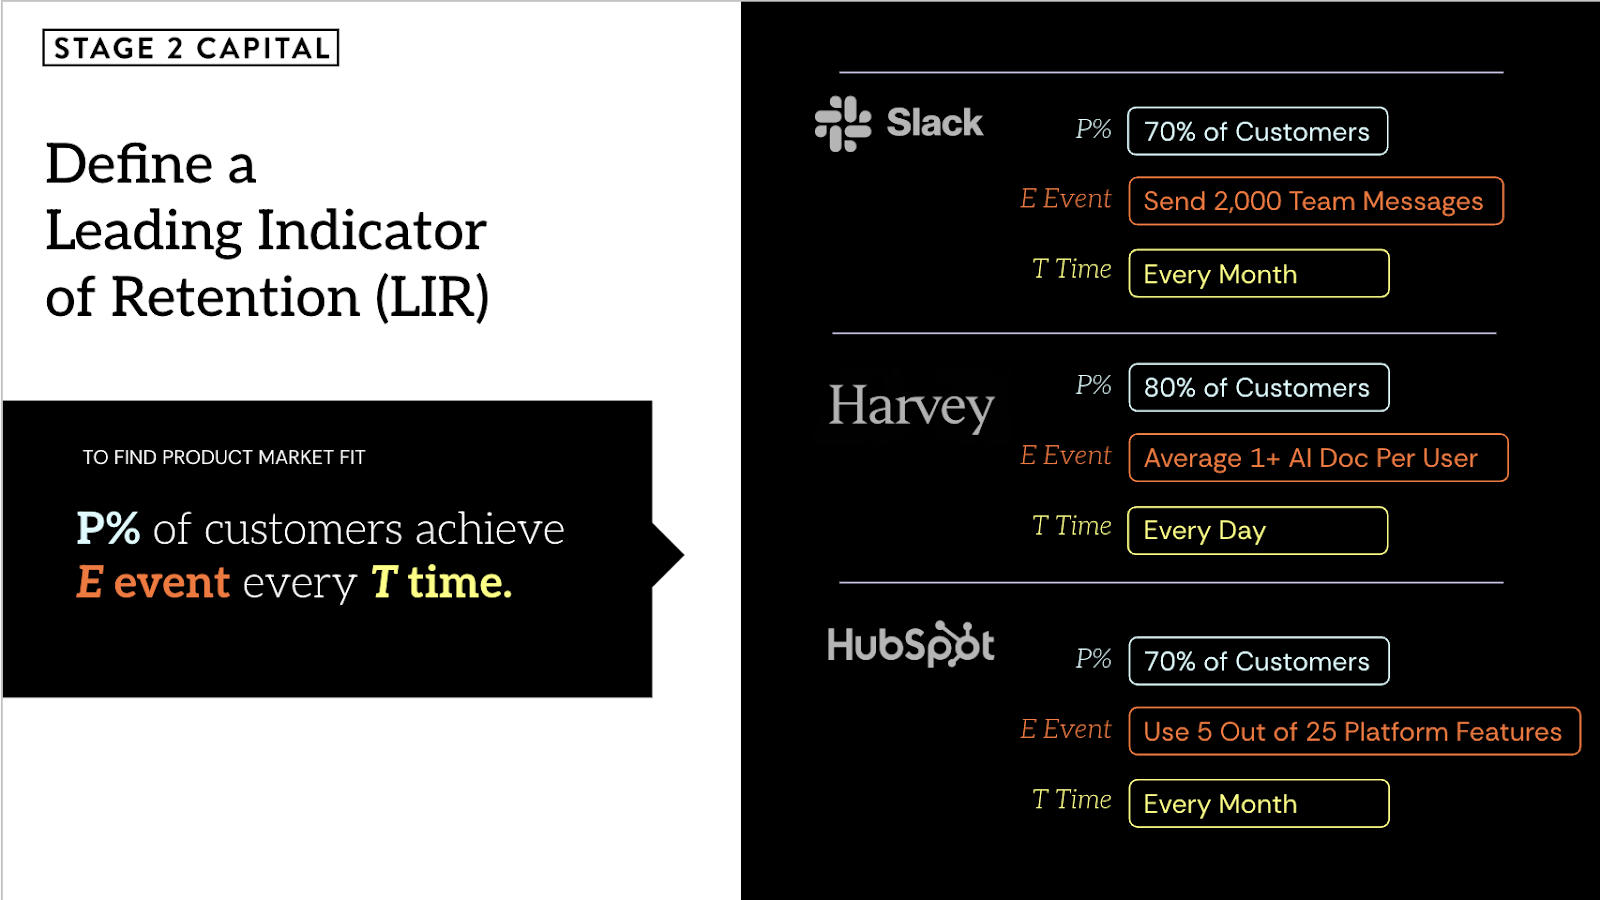
There is no universal LIR. It’s unique for every business. However, it is useful to think through your LIR using the above framework, simplifying the decision down to three variable: Percentage (P), Event (E), and Timing (T).
P - Percentage. The share of new customers that must hit the leading indicator for you to claim PMF. If your market has lots of well-funded competitors and a real first-mover advantage, set P lower (like 50%) and move faster. If you operate in a niche with high failure tolerance and a strong moat, set P higher (80%) and “nail it before you scale it”.
E - Event. The actual behavior that signals value realization. This is the variable that matters most. A good E has four properties:
Objective. Either it happened or it didn’t. “Processed the first transaction” qualifies. “Customer sees value” does not.
Instrumentable. You have to be able to track it automatically, at scale.
Tied to customer success. “Reduced processing time by 10%” qualifies. “Attended the QBR” does not.
Aligned with your unique value proposition. The whole company - marketing, sales, customer success - will be steered by this metric. It needs to push them toward your differentiation, not somebody else’s.
Consider starting with E oriented around “setup”, evolving it to “engagement”, and ending at “ROI.” Early on, “processing transactions” is enough. Later, “processed 100 transactions.” Eventually, “achieved 10% productivity gain.” The metric matures with the maturity of the business.
T - Timing. How frequently you measure it. Daily lets you learn fast. But not all product use cases call for daily usage or smooth engagement. Usually, a monthly view is a timeline that generates consistent usage metrics with a fast enough learning cycle.
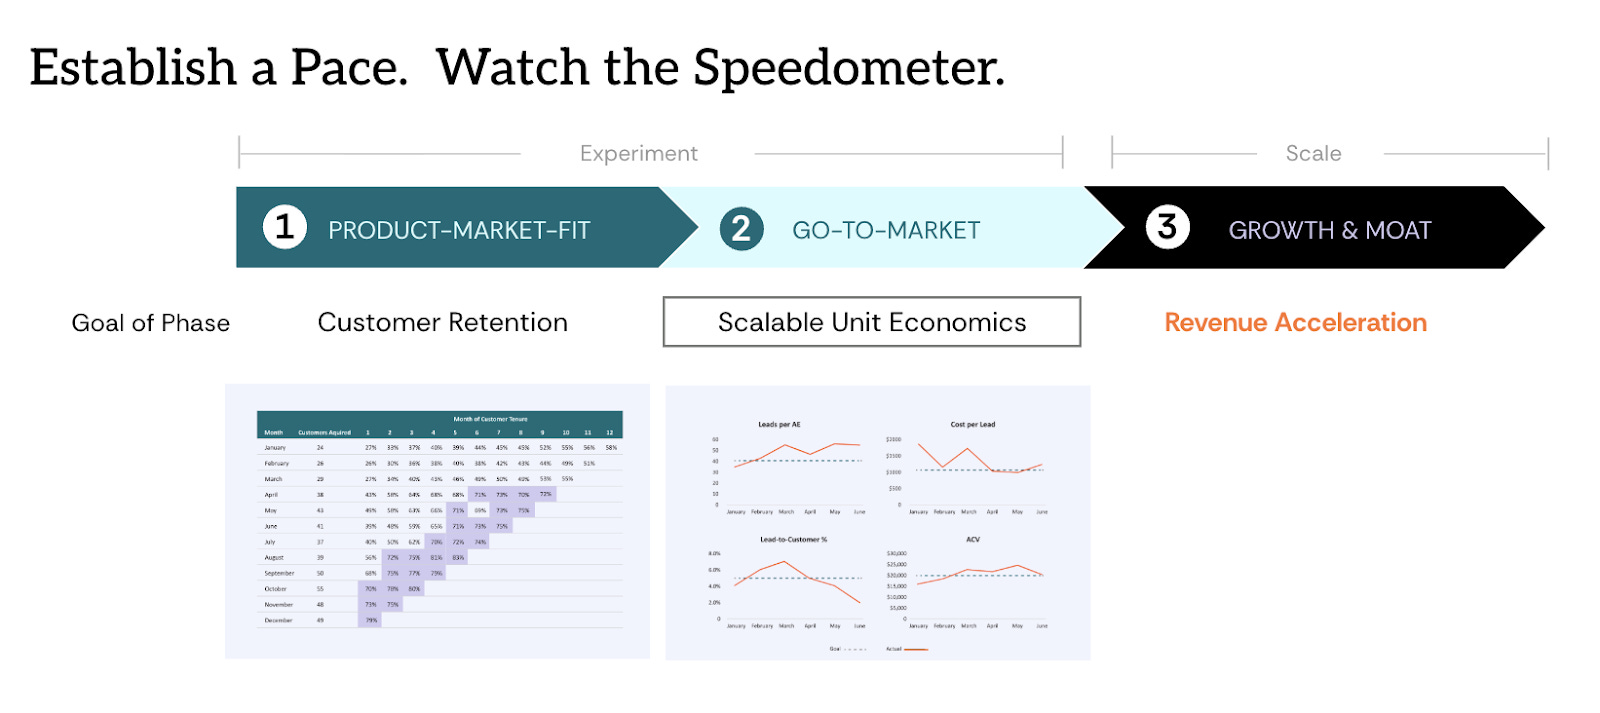
Once P, E, and T are set, instrument the LIR by acquisition cohort. Each row is the month a cohort was acquired. Each column is the percentage of that cohort hitting the LIR by month of tenure. You now have a monthly readout of whether new customers are realizing value - quarters before you’d see it in the retention number.
Two things matter most in that chart.
Recent cohorts beat older cohorts. Old cohorts were acquired before your latest product, onboarding, and positioning improvements. They aren’t representative anymore. Limit how far back the analysis goes.

The LIR cohort chart belongs in your board deck and your company-wide dashboard. If you measure something this important quarterly in a private spreadsheet, the org will not align around it.
That is how you stop calling product-market fit a feeling.
Go-to-Market Fit: Can You Acquire Customers Profitably?
Hitting PMF gives you confidence that if you add 100 customers in a segment next quarter, most of them will realize the value. However, you have not proven that you can acquire and serve them profitably.
I call this go-to-market fit, or GTMF. The ability to acquire and retain customers consistently and profitably.
Unit economics, rather than GAAP-based profitability, are used to evaluate GTMF, as unit economics isolate the business costs associated with scale. Commonly used unit economics metrics in B2B software are:
Payback period < 12 months
LTV / CAC > 3
Magic Number > 1.0
However, just like retention in the prior section on measuring product-market fit, unit economics are also lagging indicators. Fortunately, extracting unit economics back to leading indicators is far more formulaic and consistent across businesses.
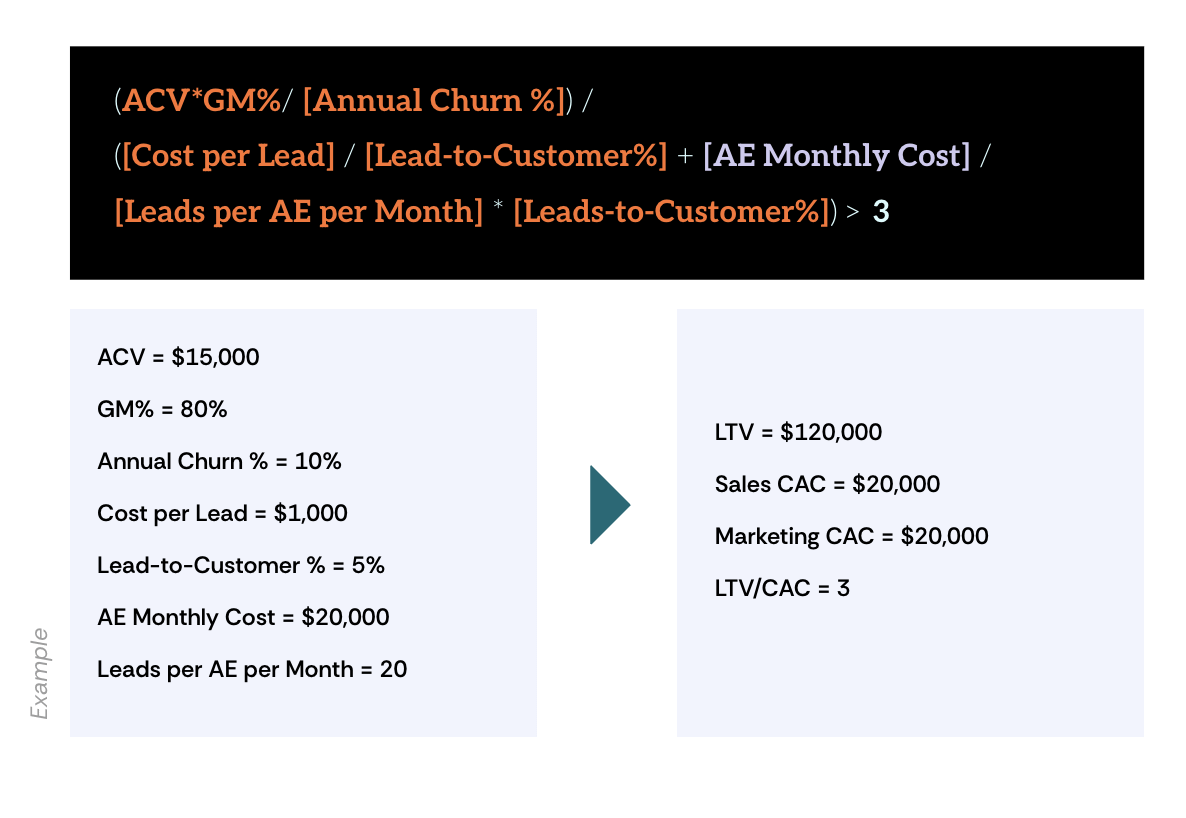
Take LTV/CAC > 3. The figure below illustrates how we can extract the desired unit economic output back into short-term operational inputs.
You now have a tree of operational metrics: cost per lead, lead-to-customer conversion, leads per rep, ACV, gross margin, and annual churn. Set a goal for each input, plug them into the formula, and confirm that the LTV/CAC output you want falls out the other side.
Then watch them weekly. If the actual line stays above the target line, you are on pace to achieve GTMF. If it doesn’t, you can see exactly which input is breaking - lead cost, conversion, capacity, or churn - and fix that one specifically rather than guessing.
The same logic works for payback period and Magic Number. Decompose, set targets, and watch the leading indicators.
This leading industry approach allows you to operate your business many quarters ahead of your competition.
Scale Is a Pace, Not an Event
With PMF and GTMF in place, we are ready to scale the new segment. However, scaling at the wrong speed is an even more prevelant failure cause that the wrong time..
The classic mistake is to treat scaling as a single event that follows a fundraiser or an annual planning cycle. Set the annual number. Calculate how many salespeople are needed to hit the number. Hire all of those salespeople as quickly as possible, ideally in the next two weeks.
This strategy fails due to a lack of appreciation for the operational processes required to hire, ramp, and manage this new velocity of salespeople. Six months later, the majority of the new hires are under-performing, LIR and LIUE deteriorates, and the next board meeting is rough.
Scale is a pace, not an event.
Plan to add 10 salespeople a month for 12 months, not 120 salespeople next month. If the system absorbs that, accelerate to twenty. If it strains, pause, diagnose, fix, resume. The optimal pace is the fastest one that doesn’t break product-market fit and go-to-market fit. The leading indicator dashboards established in the prior sections serve as your speedometer.
At Stage 2 Capital, we use a quarterly operating motion called Stay-Go-Slow. We still build an annual plan. We also pre-agree on three questions with the executive team and the board:
GO. What would we see by the end of next quarter that justifies going faster - and increasing the hire rate?
SLOW. What would we see that justifies slowing down - and pausing hiring until the issue is diagnosed?
STAY. What would we see that validates the current plan?
Each quarter, we check in. We evaluate where we landed. We adjust the next four quarters of hiring. We update the forward plan.
Most teams operationalize Stay-Go-Slow against three thresholds:
All three green: GO. Accelerate hiring. Update the forward plan up.
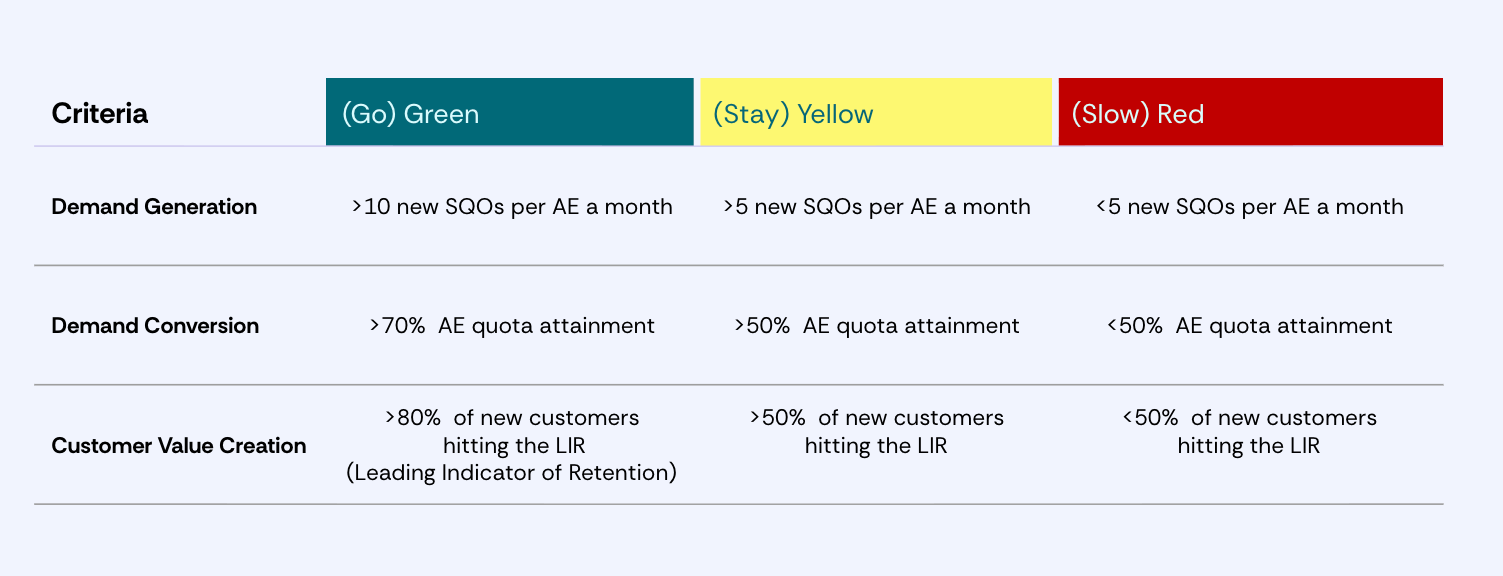
Mixed green and yellow: STAY. Hold the plan.
Any red: SLOW. Decelerate or stop hiring. Diagnose the issue. Fix it as soon as possible, hopefully in days and not quarters. Re-establish the hiring pace once the issue is addressed. Update the forward plan down.
Two things tend to come up the first time I introduce this with a board.
The first is the IRR worry. Investors get nervous that slowing down kills their return profile. It usually doesn’t. Successful exits happen on a five-to-ten-year arc. Acquirers don’t care about your Q2-to-Q3 growth rate from eight years ago. They care about the most recent two years, at most. The same lens is true for the next growth investor. Their perception of the scale capability of the business is weighted toward recent quarters versus 6 quarters ago. Disciplined pacing protects the long compound. Reckless pacing destroys it.
The second is the accountability worry. If you adjust the forward plan when conditions change, do reps stop hitting their numbers? Two answers. First, you keep tracking the original plan for performance management and comp. Otherwise, teams hide behind the revised forecast. Second, this isn’t about reducing accountability. It’s about managing the business with the latest information. Those are different things.
The Real Goal
Half the executives I meet scale too early and too fast. Half scale too late and too slow.
The risk of moving too slowly is just as real as moving too quickly. Competitors raise capital. Market windows close. Press releases pile up around someone else’s name. Movement matters.
But movement toward the wrong milestone is just expensive motion. Move quickly toward the right milestone, at the pace your organization can absorb. Instrument product-market fit and go-to-market fit. Then scale at the fastest pace those two instruments will tolerate.
The goal is not a short-term “triple, triple, double, double.” The goal is a long-term home run.
Good luck with the science of scaling.
Maja here.
If you read this and felt the small twist in your stomach that says we are doing this wrong - good. That is the most useful response you can have to Mark’s framework.
The most concrete thing you can do this week:
Write down your current LIR. Sit with your CRO or head of growth. Pick a P, an E, and a T. Don’t make it perfect. Pick something, instrument it, and revisit in 30 days.
Decompose the unit economic target your board cares about most - LTV/CAC, payback, or Magic Number - into the four to six input metrics that drive it. Set a goal for each. That’s your LIUE dashboard.
Run a Stay-Go-Slow conversation at your next board meeting. Even if you don’t change the plan, the conversation will surface where your team and your board actually disagree about pace.
This piece is based on Mark’s book The Science of Scaling. If you’re serious about scaling, I definitely recommend reading it, as it includes much more on using data to decide when and how fast to scale revenue. Mark is also donating 100% of the proceeds of the book to mental health, so get some copies for your team as well.
And for more GTM wisdom from Mark and his team, subscribe to the GTM in Practice Substack.
Until next time,
Maja

✅ Need ready-to-use GTM assets and AI prompts? Get the 100-Step GTM Checklist with proven website templates, sales decks, landing pages, outbound sequences, LinkedIn post frameworks, email sequences, and 20+ workshops you can immediately run with your team.
📘 New to GTM? Learn fundamentals. Get my best-selling GTM Strategist book that helped 9,500+ companies to go to market with confidence - frameworks and online course included.
📈 My latest course: AI-Powered LinkedIn Growth System teaches the exact system I use to generate 7M+ impressions a year and 70% of my B2B pipeline.
🏅 Are you in charge of GTM and responsible for leading others? Grab the GTM Masterclass (6 hours of training, end-to-end GTM explained on examples, guided workshops) to get your team up and running in no time.
🤝 Want to work together? ⏩ Check out the options and let me know how we can join forces.